Introduction
In today's digital world, data is everywhere. Every time someone visits a website, clicks on an advertisement, watches a video, or buys a product online, valuable information is created. This information is known as data, and when businesses study it to understand customer behavior and improve their decisions, the process is called analytics.Analytics is no longer limited to large corporations. Small businesses, startups, bloggers, digital marketers, and eCommerce stores also rely on analytics to understand what works and what needs improvement. Instead of making decisions based on assumptions, analytics allows businesses to use real information to plan their strategies.As technology continues to evolve, analytics has become one of the most valuable tools for making smarter, faster, and more profitable business decisions.
What is Analytics?
Analytics is the process of collecting, organizing, analyzing, and interpreting data to discover useful insights that support better decision-making.Simply collecting data is not enough. The real value comes from understanding what the data means and using those insights to improve products, services, marketing campaigns, and customer experiences.For example, a company may collect information about:Website visitorsProduct salesCustomer purchasesSocial media engagementEmail marketing performanceAdvertising campaignsBy analyzing this information, businesses can answer important questions such as:Which products are most popular?Where do customers come from?Which marketing campaign generates the most sales?Which pages have the highest bounce rate?What time of day do customers make the most purchases?
Why Analytics Matters for Every Business?
Modern businesses generate massive amounts of data every day. Without analytics, this data remains unused. Analytics converts information into actionable insights that help organizations improve performance across different departments.
Better Decision-Making:-
One of the biggest advantages of analytics is better decision-making. Instead of relying on guesswork, businesses use accurate data to choose the right marketing strategies, products, and investments.
For instance, if analytics shows that most customers purchase products through mobile devices, a company can focus on improving its mobile website instead of spending resources elsewhere.
_____________________________________________________
Understanding Customer Behavior:-
Every customer behaves differently. Analytics helps businesses understand:
What customers are searching for
Which products they prefer
How long they stay on a website
What causes them to leave
Which pages encourage purchases
These insights help create a better customer experience.
________________________________________________________
Improving Marketing Performance:-
Digital marketing becomes much more effective when supported by analytics.
Businesses can measure:
Website traffic
Advertisement performance
Email open rates
Click-through rates Social media engagement
Lead generation Sales conversions
Instead of spending money blindly,
marketers can invest more in campaigns that deliver the best results.
_____________________________________________________________
Increasing Revenue:-
Analytics identifies opportunities to improve sales.
For example:
Recommend products customers are likely to buy.
Reduce shopping cart abandonment.
Optimize product pricing.
Improve checkout processes.
Target high-value customer segments.
Small improvements based on data often lead to significant revenue growth.
_____________________________________________________________
Reducing Business Risks:-
Businesses constantly face uncertainty.
Analytics helps reduce risks by identifying trends before they become major problems.
Examples include:
Detecting declining sales
Identifying low-performing products
Predicting customer churn
Monitoring inventory shortages
Tracking seasonal demand
Early insights allow businesses to respond quickly and make informed decisions.
Types of Analytics
1. Descriptive Analytics
=>Descriptive analytics explains what has already happened by analyzing past data. It helps businesses understand trends, performance, and results through reports and dashboards.
2. Diagnostic Analytics
=>Diagnostic analytics identifies why something happened. It examines data to find the root causes behind changes, helping businesses understand both successes and challenges.
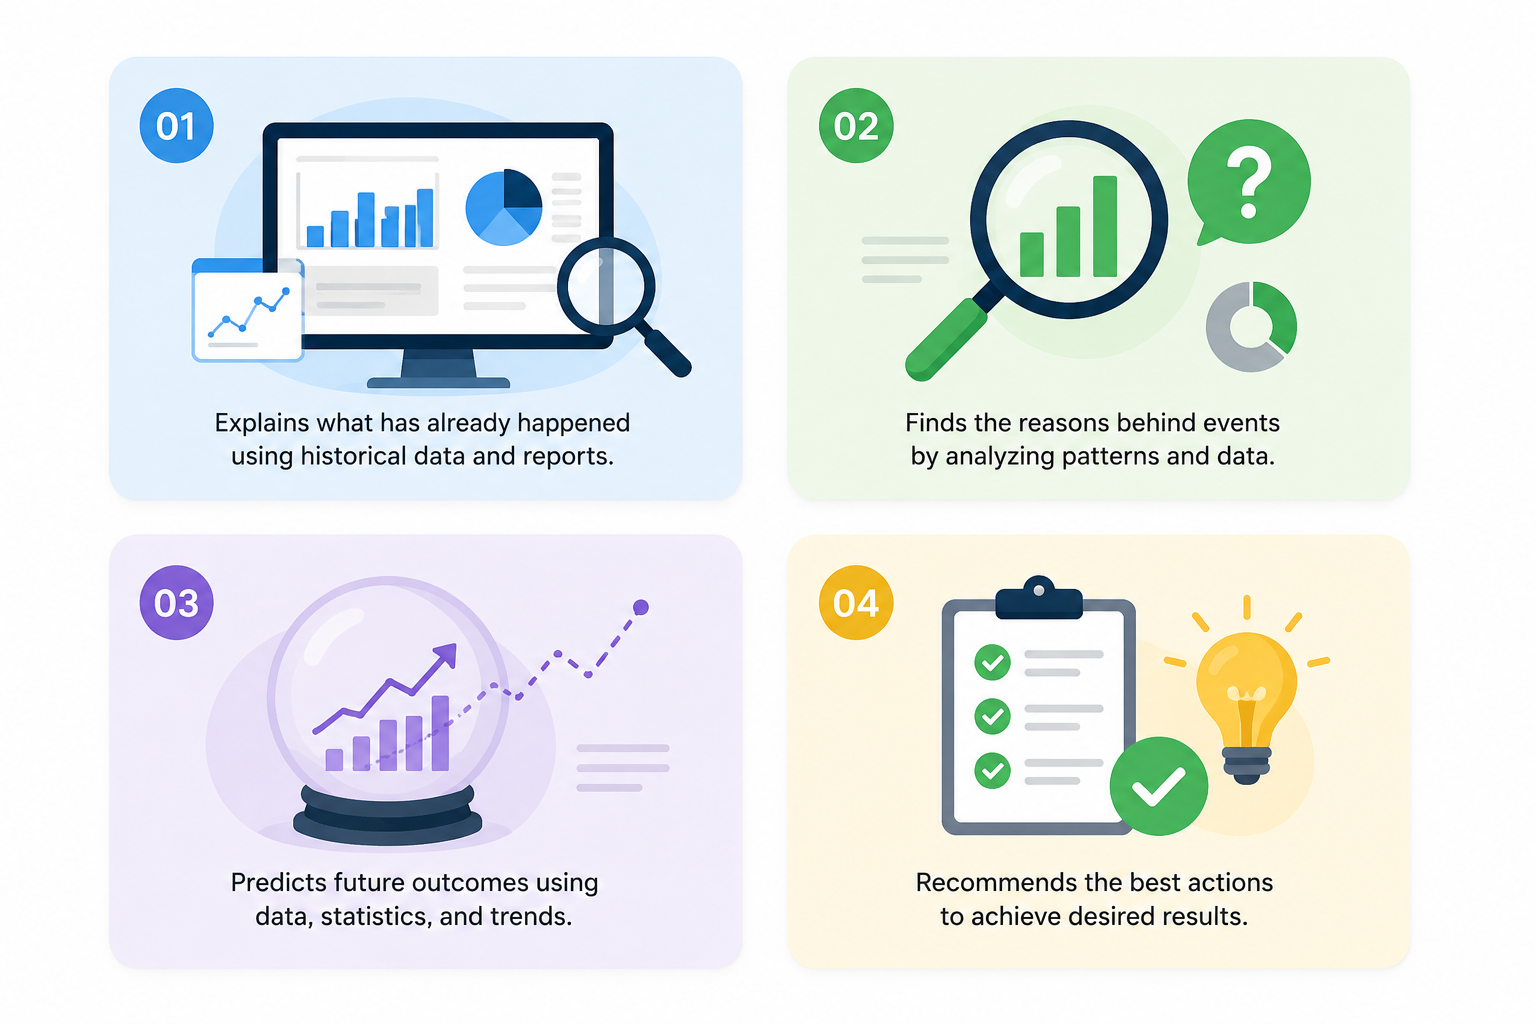
3. Predictive Analytics
=>Predictive analytics uses historical data and statistical models to forecast future outcomes. It helps businesses anticipate customer behavior, market trends, and potential risks.
4. Prescriptive Analytics
=>Prescriptive analytics recommends the best actions to take based on data insights. It helps organizations make smarter decisions by suggesting strategies to achieve the best possible results.
How Analytics Works?
Although analytics tools appear complex, the overall process follows a simple sequence.
Step 1: Data Collection
The first step is collecting data from different sources, such as:
Websites
Mobile applications
CRM software
Social media platforms
Online stores
Email marketing tools
Customer surveys
The more reliable the data, the more accurate the insights.
Step 2: Data Cleaning
Raw data often contains duplicate records, missing values, or incorrect information. Cleaning the data improves accuracy and ensures trustworthy analysis.
Step 3: Data Analysis
Analysts and software examine the cleaned data to identify patterns, trends, relationships, and opportunities that support business goals.
Step 4: Data Visualization
The results are displayed through charts, graphs, and dashboards, making complex information easier to understand for decision-makers.
Step 5: Taking Action
Finally, businesses use these insights to improve marketing campaigns, optimize products, enhance customer experiences, and make smarter strategic decisions.
Key Analytics Metrics Every Business Should Track
1. Website Traffic: Measures the number of people visiting your website and helps evaluate your online reach.
2. Bounce Rate: Shows the percentage of visitors who leave after viewing only one page, indicating how engaging your website is.
3. Conversion Rate: Tracks how many visitors complete a desired action, such as making a purchase or filling out.
4. Average Session Duration: Measures the average time users spend on your website. Longer sessions usually indicate valuable content.
5. Customer Acquisition Cost (CAC):Calculates how much it costs to acquire a new customer through marketing and sales efforts.
6. Customer Lifetime Value (CLV):Estimates the total revenue a customer is likely to generate during their relationship with your business.
7. Return on Investment (ROI):Measures how profitable your marketing campaigns or business investments are compared to their cost.
Popular Analytics Tools
#Google Analytics – Tracks website traffic, user behavior, and conversions.
#Google Search Console – Monitors website performance and search visibility on Google.
#Looker Studio – Creates interactive dashboards and easy-to-understand reports.
#Microsoft Power BI – Visualizes business data through powerful charts and dashboards.
#Tableau – Analyzes large datasets and presents insights with interactive visuals.
#Hotjar – Uses heatmaps and session recordings to understand user behavior on websites.
#Mixpanel – Tracks user actions and product engagement, especially for apps and SaaS platforms.
#Adobe Analytics – Provides advanced customer journey and marketing performance insights for enterprises.
Real-World Applications of Analytics
Analytics is valuable across almost every industry because it supports better decision-making.
->Digital Marketing
Marketers use analytics to measure campaign performance, identify successful advertising channels, and improve return on investment. They can determine which keywords, social media platforms, or email campaigns generate the highest conversions.
->E-commerce
Online stores analyze customer journeys, purchasing behavior, product performance, and abandoned shopping carts. These insights help improve sales and customer satisfaction.
->Healthcare
Hospitals use analytics to optimize patient care, monitor treatment outcomes, manage resources efficiently, and predict healthcare demands.
->Banking and Finance
Financial institutions rely on analytics to detect fraud, assess credit risks, forecast financial performance, and understand customer spending patterns.
->Education
Schools and universities analyze student performance, attendance, and learning patterns to improve educational outcomes and provide personalized learning experiences.
->Manufacturing
Manufacturers use analytics to monitor production efficiency, reduce equipment downtime, improve quality control, and manage supply chains more effectively.
These examples demonstrate that analytics is no longer limited to technology companies—it has become an essential part of nearly every industry.
Common Challenges in Analytics
Although analytics offers many advantages, businesses may encounter several challenges.
Poor Data Quality - Incomplete, outdated, or inaccurate data can lead to incorrect conclusions and poor decision-making.
Information Overload-Modern organizations collect enormous amounts of data. Without clear objectives, it becomes difficult to identify which information truly matters.
Lack of Skilled Professionals- Analyzing data effectively requires technical knowledge and business understanding. Organizations may struggle if they lack experienced analysts.
Privacy and Security- Businesses must collect and store customer information responsibly while complying with data privacy regulations
The Future of Analytics
The future of analytics is becoming smarter with the help of Artificial Intelligence (AI), Machine Learning (ML), and automation. Businesses will be able to analyze data in real time, predict customer needs, and make faster, data-driven decisions. As technology continues to evolve, analytics will play an even bigger role in improving customer experiences, increasing efficiency, and driving business growth.